
Nextbus is great.
It tells me how many minutes I have before I have to start running to catch the bus.
Nextbus estimates use GPS which is definitely smarter than the static bus schedule, but how accurate is it really?
I feel like I’ve found myself waiting for what seems like 10 minutes at the bus stop
when Nextbus continually tells me I have just a few minutes left to wait.
To figure this out, I pulled predictions from the WMATA (Washington Metropolitan Area Transit Authority) API every 10 seconds for about a week.
I selfishly collected data for just my bus (the southbound 64) for my stop in Petworth (5th & Taylor St NW).
What does 5 minutes really mean?
When Nextbus predicts 5 minutes, 80% of the time you can expect to wait between 4.5 and 7.2 minutes. Not perfect, but not terrible.
How often is the bus late?
81% of the time. Interact with the app below to see the range of actual wait times you can expect for any Next Bus prediction.
Early days are defined such that there is a 10% chance the bus will arrive before the early day wait time.
Late days are defined such that there is a 10% chance the bus will arrive after the late day time.
Which predictions to trust?
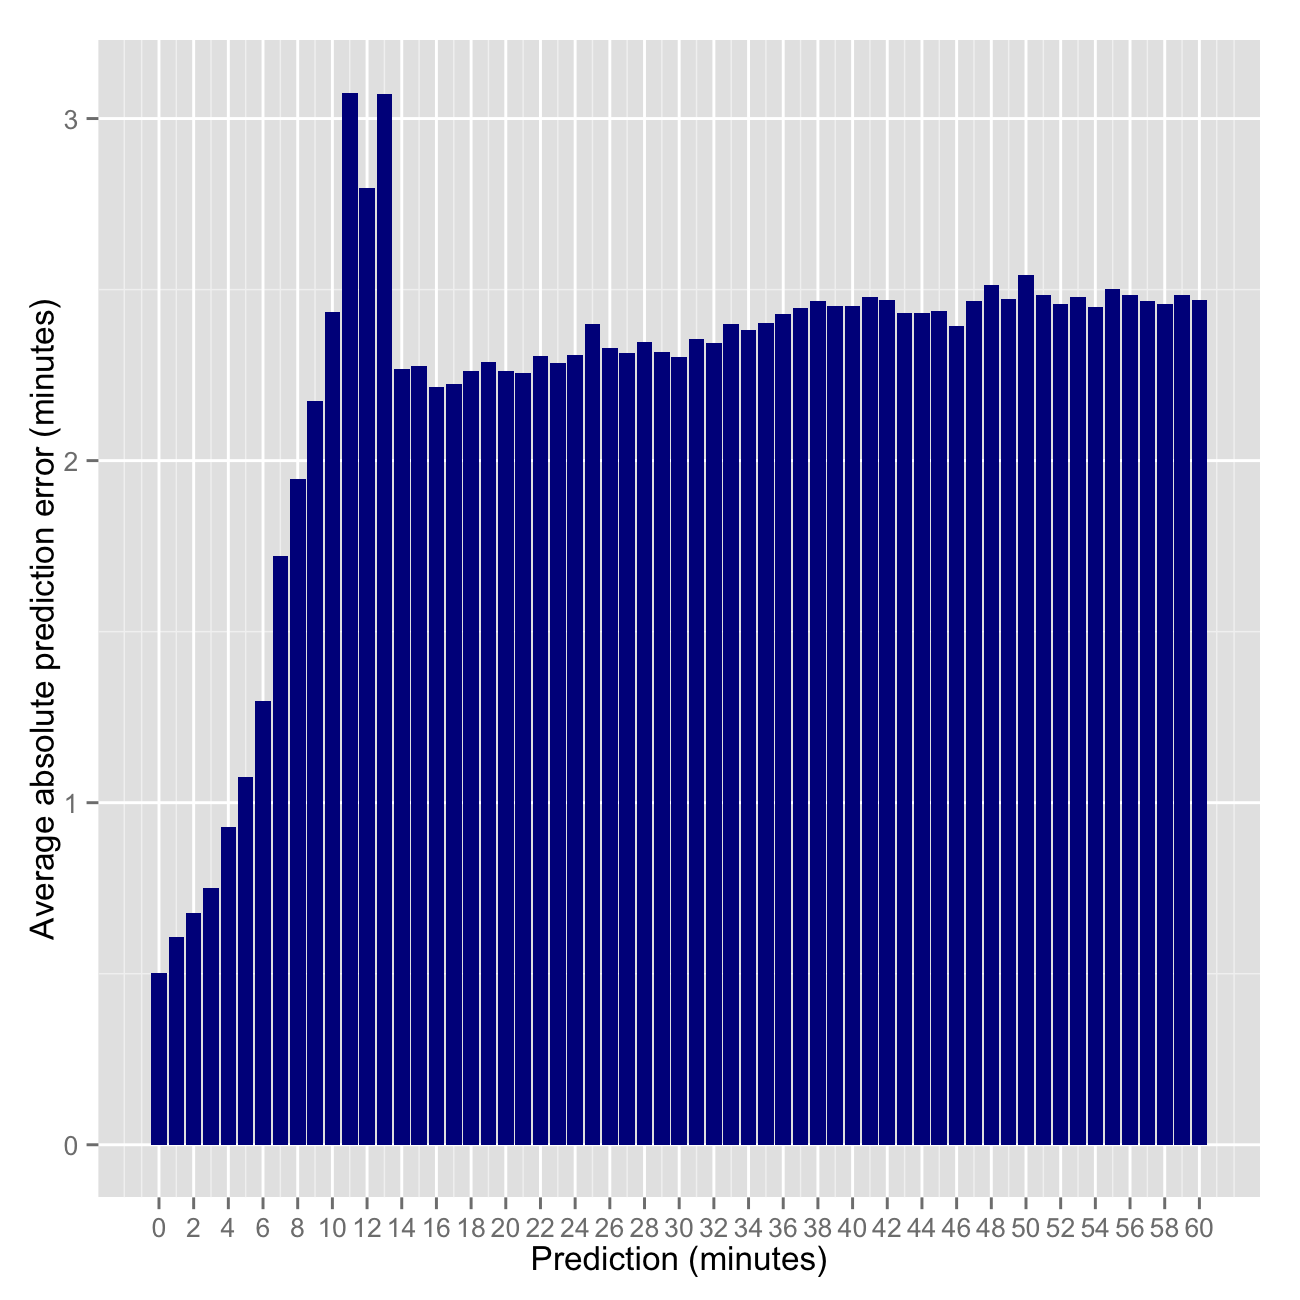
For predictions of 5 minutes or less, prediction errors are relatively small – less than 1 minute in either direction. Not very surprising.
However, Next Bus predictions quickly become less reliable after 5 minutes.
Strangely, predictions are least reliable for predictions of 11,12,13 minutes.
This is interesting. It appears Next Bus predictions are more accurate when the bus is 60 minutes away than when the bus is just 12 minutes away.
After the weird spike of 3 minute errors around predictions of 11,12,13 minutes, the average absolute prediction error flattens out to around 2:15-2:30 minutes.
Are prediction errors caused by late or early buses?
Short answer: late buses.
There is sizable conservative bias (predicting longer wait times than needed). This bias is the mass of red waves above the dotted line (the 81% of buses that arrive late).
For predictions of 15 minutes or more, there is just a 5% chance the bus will arrive at least 1:30 minutes early, while there is a 52% chance the bus will arrive at least 1:30 minutes late.
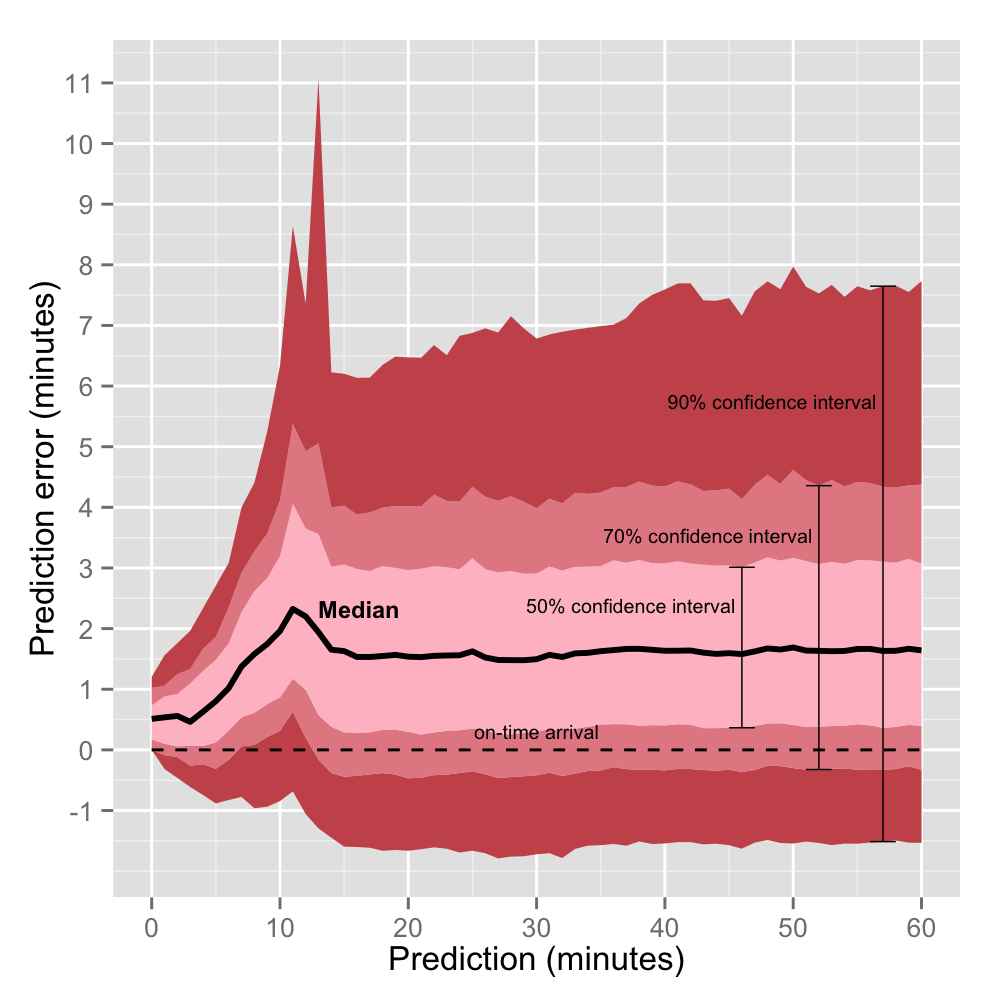
How late is late?
- 70% of the time buses arrive between 30 seconds early and 4 minutes late for predictions of 15 minutes or more.
- 70% of the time buses arrive between 19 seconds early and 1:52 minutes late for predictions of 5 minutes.
However, these margins of error widen quite a bit when we want to be 90% sure when the bus will arrive(the dark red area). These are the nasty outliers.
- 90% of the time buses arrive between 1:30 minutes early and 7 minutes late for predictions of 15 minutes or more.
- 90% of the time buses arrive between 53 seconds early and 2:43 minutes late for predictions of 5 minutes.
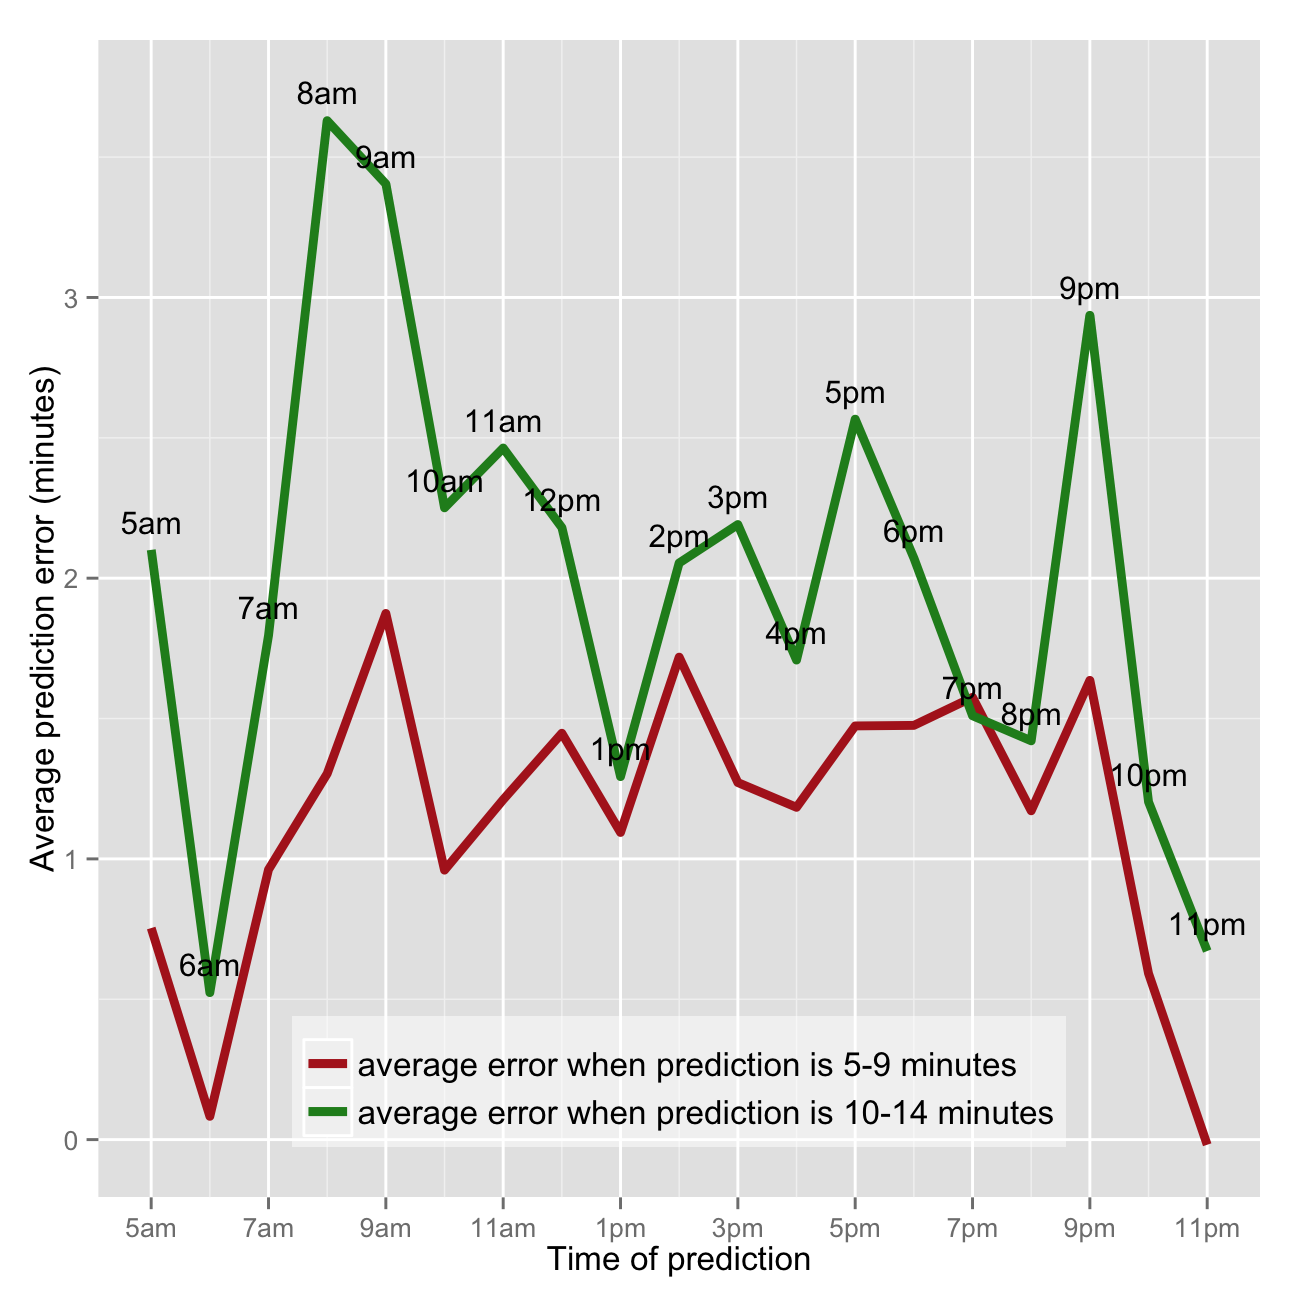
Does rush hour traffic affect Next Bus?
It appears it does. Predictions are off the mark (late) most in the morning between 8am and 10am.
One week of Nextbus predictions:
Each circle is a prediction in the app below. Red circles indicate predictions that turn out to be late.
Green circles indicate predictions that turn out to be early. If predictions are consistently accurate, you will see a straight diagonal line.
Predictions often follow a consistent trend (straight diagonal line) until some point where predictions prematurely jump to 11, 12, or 13 minutes, when in reality, there is much longer to wait. There are also some gradual bends in the graphic around 10-15 minutes which indicate that predictions are often initially optimistic, but later revised upward (delayed).
What does Next Bus say?
In general though, the margin of error is less than one minute for predictions of five minutes away or less. For ten-minute predictions, the margin of error is less than two minutes. Predictions are biased slightly early to avoid people missing buses.
What does the data say?
The data generally corroborates Next Bus’s claims…
In general though, the margin of error is less than one minute for predictions of five minutes away or less.
True 71% of the time.
For ten-minute predictions, the margin of error is less than two minutes
True 79% of the time.
Predictions are biased slightly early to avoid people missing buses
True: 81% of predictions are late.
Assumptions
- When Next Bus says a bus is arriving multiple times, I take the latest prediction before the bus disappears off your Next Bus app as the arrival time.
- Remove bus trips that never arrive. There are some ghost buses out there. It’s impossible to determine the error in a prediction if you don’t know the outcome (true arrival time), so these trips are removed.
Under the hood
Posts on the making of this project can be found here:
This project on: github